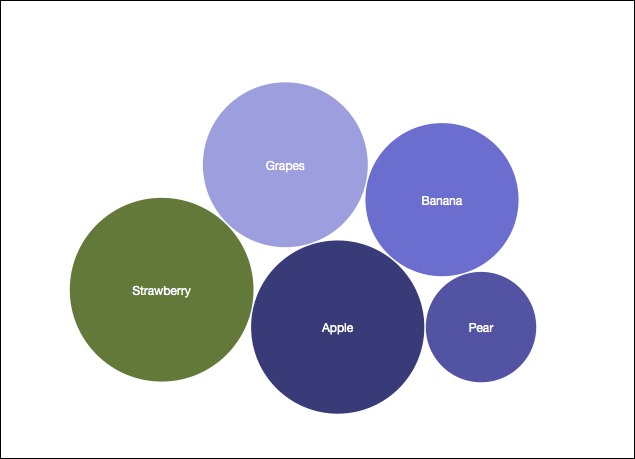
How to make a basic Bubble Chart in D3
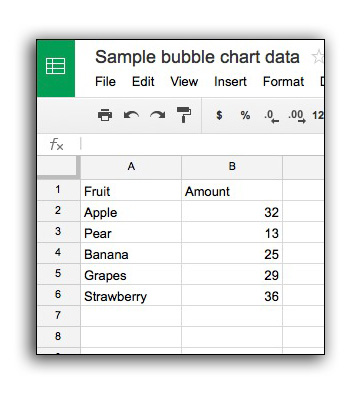
Getting your data into CSV format
Use a spreadsheet program to export your data as a CSV
The var diameter = 500 will determine the maximum dimensions of the area of the circle pack chart.
The color scale we use is d3.scaleOrdinal(d3.schemeCategory20c), but you may use one of the other color scales provided by d3.
Alternatively, you can use your own color scale by setting up an ordinal or linear scale, and specifying the domain as several colors .range(["#000000", "#ffffff"]).
NOTE: Example below uses D3js Version 4.
Full example below
var diameter = 500, //max size of the bubbles
    format   = d3.format(",d"),
    color    = d3.scaleOrdinal(d3.schemeCategory20c); //color category

var bubble = d3.pack()
    .size([diameter, diameter])
    .padding(1.5);

var svg = d3.select("body")
    .append("svg")
    .attr("width", diameter)
    .attr("height", diameter)
    .attr("class", "bubble");

d3.csv("fruit.csv", function(error, data){
    if (error) throw error;

    //convert numerical values from strings to numbers
    data = data.map(function(d){ d.value = +d["Amount"]; return d; });

    //Sets up a hierarchy of data object
    var root = d3.hierarchy({children:data})
      .sum(function(d) { return d.value; })
      .sort(function(a, b) { return b.value - a.value; });

    //Once we have hierarchal data, run bubble generator
    bubble(root);

    //setup the chart
    var bubbles = svg.selectAll(".bubble")
        .data(root.children)
        .enter();

    //create the bubbles
    bubbles.append("circle")
        .attr("class", "circle")
        .attr("r", function(d){ return d.r; })
        .attr("cx", function(d){ return d.x; })
        .attr("cy", function(d){ return d.y; })
        .style("fill", function(d) { return color(d.value); });

    //format the text for each bubble
    bubbles.append("text")
        .attr("x", function(d){ return d.x; })
        .attr("y", function(d){ return d.y + 5; })
        .attr("text-anchor", "middle")
        .text(function(d){ return d.data["Fruit"]; })
        .style("fill","white")
        .style("font-family", "Helvetica Neue, Helvetica, Arial, san-serif")
        .style("font-size", "12px");
});